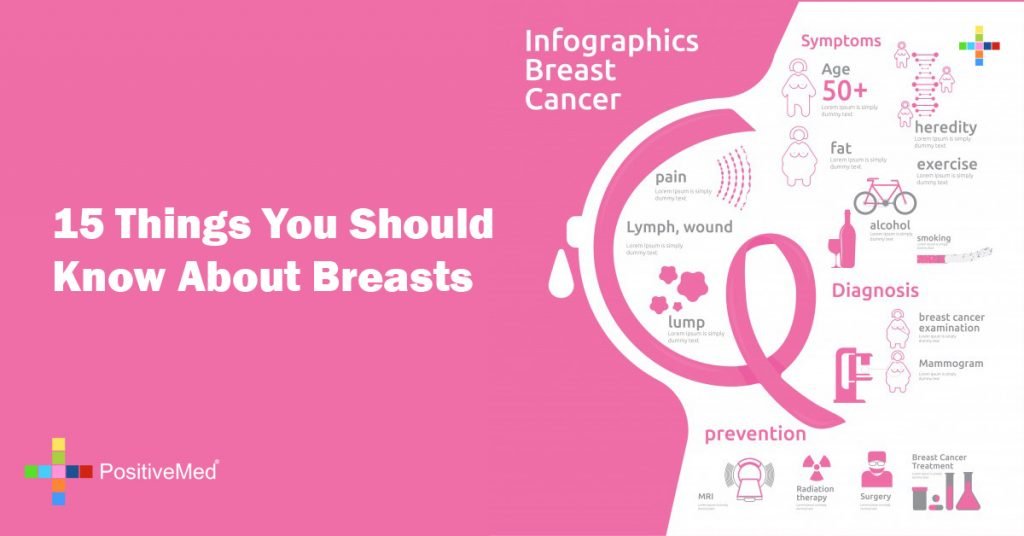
15 Things You Should Know About Breasts
You can find 15 interesting facts about breasts in this infographic: Designed by Jason Powers
15 Things You Should Know About Breasts Read More »
You can find 15 interesting facts about breasts in this infographic: Designed by Jason Powers
15 Things You Should Know About Breasts Read More »
Are you vegetarian? Do you know any vegetarian? If so what type of vegetarian you/they are? lacto-ovo? fruititarian? What are the reasons to be vegetarian? Surprisingly, Skittles, Jell-o and Mini-Wheats contain gelatin, which is made from boiled animal skin, tendons and bones! Find out the answers in this simple, yet amazing poster: Learn about infographics
Veg-nited We Stand! Read More »
This is the truth: We are a society addicted to sugar, and sugar is addictive as much as cocaine is! Even when you try to quit sugar, you’d have withdrawal symptoms! Sugar consumption is increasing every day and it is mind-blowing! Just take a look at the numbers! “The consumption of sugar will

Unlike what you see in the ads, bottled water is not cleaner, tastier or more beneficial for the body than tap water. For example, as a research conducted by The Natural Resources Defense Council announced, 22% of bottled waters contain more chemicals than the States health limits. Check out 10 reasons to drink more
10 Reasons to Drink Tap Water Read More »
This guide by far is the best guide I’ve ever seen for those who love to cook! You can find useful information from unit conversions to meat cuts, cooking times, storage guide and even freezer storage times. So maybe it’s not a bad idea to print it and hang it on your fridge! For a
Kitchen Cheat Sheet Read More »
Aloha Hawaii! Hawaiians had the highest well-being in the U.S for the last three consecutive years. In fact, Hawaii ranked the highest in the nationwide survey in emotional health (how likely a resident smiles or laughs everyday, or if they have a daily stress or worry) and in healthy behaviors (exercising, not smoking and eating
Sense of Well-Being Read More »
Coffee is the drink of choice for many of us and there’re many interesting facts about it. For example, did you know that New Yorkers drink 7 times more coffee than people in other major cities in the US? Check out this infographic and learn which professionals drink the most coffee! It’s amazing that scientists
Which profession drinks the most coffee? Read More »
This infographic is really interesting! Have you ever thought that we see this world different than all animals?
How Animals See the World Read More »

In every corner of the world, car accidents are one of the major causes of trauma and death. For example in the United States, each year trauma accounts for 42 million emergency department visits and 2 million hospital admissions across the nation. Crash test dummies have made our cars substantially safer and have undoubtedly saved
Dissecting a Crash Test Dummy Read More »

I’ve talked with many people who are dealing with Alzheimer’s patients and they all say one thing in common: Alzheimer’s Disease is the most devastating disease they know. Maybe they see the issue they’re dealing with as the worst pain in the world, or maybe this is the sad truth. Check out this infographic to
Living With Alzheimer’s Disease Read More »
Did you know that there are more than 50,000 centenarians (people who are 100 years and older) living in the U.S. and the number is growing? Please take a look at this fascinating group of people and what we can learn from the centenariThe Centenarian Lifestylean lifestyle. Here are some interesting highlights: While there are
The Centenarian Lifestyle Read More »
Did you know, millions are unintentionally poisoned each year, and a majority of those are children under 6-yers-old? The designers of this infographic did some extensive research into everyday poisons in people’s homes, and uncovered some interesting findings — In 2010 there were over 2.3 million human exposures and almost 100,000 animal exposures (90% dogs).
Everyday Poisons In Your Home Read More »

It’s no wonder why running is becoming increasingly popular. All you need is a pair of running shoes and some motivation to help you improve your overall health and mood. Check out this useful infographic to learn how running can help you.
Running Toward a Better You Read More »

Chiropractic is a safe and effective tool in treatment of a variety of health conditions, such as back pain, neck problems and headache. In this infographic you can find the top 5 chiropractic myths and will learn more about this practice of alternative medicine. Source: GoChiroPractice.com Have you ever experienced chiropractic? How was
Top 5 Chiropractic Myths: Read More »
Almost 350 million people worldwide suffer from diabetes. Diabetes is the 5th most common cause of death in the world. There are two types of diabetes: type I and type II..Learn more about the differences between the two types of diabetes in this infographic: Infographic by Lloyds Pharmacy To check out the symptoms of diabetes,
Diabetes – Discover the difference between Type 1 and Type 2! Read More »
You are hungry and you’re looking for something to grab to satisfy hunger. Which one should you choose? A banana or a cookie? and why? You can find the answer to this question in this infographic. Also you’d learn more about “The Satiety Index” which is a measure of how full you are after eating
Are bananas as bad for you as cookies? Read More »
Almost 1 in 5 children between the ages of 6-9 in the United States are obese. High sugar intake, fast food, unhealthy snacks, TV ads and poor family control are among the main reason of childhood obesity. Surprisingly, the average American child consumes 32 teaspoons of sugar per day! This is highly above the amount
In this infographic you’d find everything you need to know about headaches. Almost all of us have had a headache at some time with different causes . Besides medication options, you can find 8 easy remedies for headache in this infographic. Also this poster shows the common locations of headaches.
All About Headaches Read More »